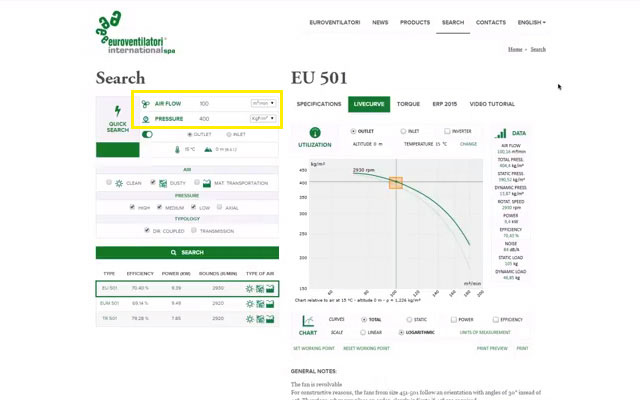
The LiveCurve software performed by Euroventilatori International allows the user to simulate the aeraulic curves for the range of fans that our company produces, in order to be able to make an initial selection of the fan types which are most suitable for his own needs.

LiveCurve Interface: you can see the working point indicated on the graph and the position of the panel for the selection of air flow and pressure values.
But what makes Livecurve the most advanced software for the simulation of air flow/pressure curves on the market?
As well as the basic features, which have been described in the last post, Livecurve allows the user to simulate and instantly make comparisons among many curves that represent the relation between the two parameters, speeding up the selection process of the most suitable industrial fan.
Let’s get into the possibilities offered by this appliance and let’s take a closer look at some advanced features of this interface: the most captivating element is obviously the Livecurve graphic on the right.
It provides the immediate representation of the air flow/pressure graph, which is developed according to the working point that was selected earlier choosing the required values.
A little orange rectangle on the graph indicates the working point, the point on the graph located by the values you have selected. This point is part of the curve which refers to the chosen fan type, as indicated in the list on the left below on the display.
If we choose a different Fan Type, we will see how the curve changes, since every fan has its own specific curve. Otherwise, the working point will always be the same we have chosen, even if it will be placed differently on the curve we see.
On the Data Panel, on the right, you can find the explanation and summary of the values of air flow, pressure (total, static and dynamic), rotation speed, power (kW), efficiency, noise level and load (static and dynamic) that refer to the working point you have selected.
That is a very important and extremely useful feature: if you move the mouse over the curve and you scroll it, you will see that the information reported on the Data chart, which summarizes all data on the right, will consequently change. This way you can see all the values concerning the relation/ratio of air flow/pressure which refer to the fan type you are currently analyzing.
If you click on a point of the curve, a temporary working point will be set: changing the fan type, it will be maintained for the air flow value and we will immediately obtain the corresponding pressure value.
To identify the conditions where the chosen fan type will work, LiveCurve provides the Utilization Area right above the graph: here you can select the modality (inlet or outlet), change the altitude and the temperature where the fan will work or switch to the inverter mode, where you can explore the graph to find the working point that better fits your needs.
If you want to see also the curves that represent the power and the performance, you only need to choose the related options on the graph panel, where you can even change the units of measurement and the type of visualization, choosing between static curve or dynamic pressure curve, and between logarithmic and linear scale.
Livecurve is an original simulator which allows the user to choose the industrial fan which better fits his needs and to make an initial selection among the items: however it is very important that plant engineers and technical experts analyze each specific case, in order to adapt the features, if necessary, to the customer’s needs and to create this way a real custom-made machinery.
Here is the Video Tutorial on the Euroventilatori International Youtube channel:
Leave a Reply